Maryland Data
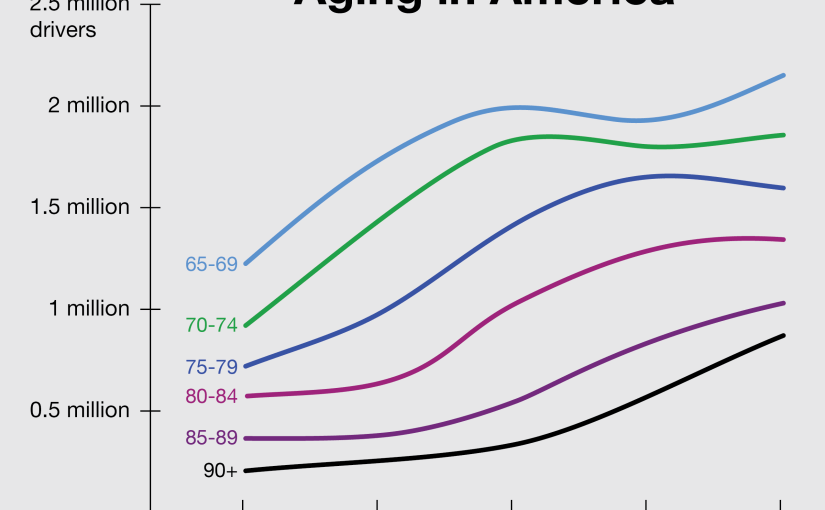
Older Drivers To Triple In Size
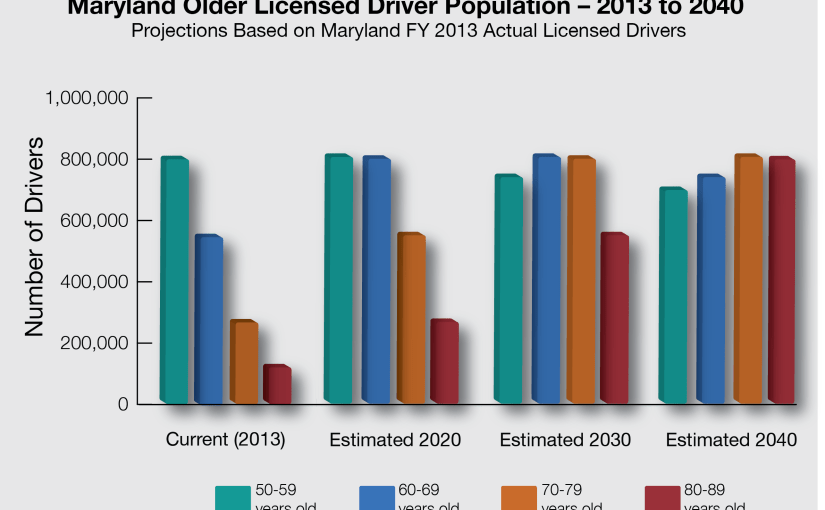
Rapidly changing demographics will double the number of Maryland drivers over 70 in just 7 years and more than triple the number of drivers over 70 in 15 years. The baby boomers, the largest generation in American history, total 83 million and represent about one-quarter of the U.S. population. Sometimes referred to as a ‘senior tsunami,’ the number of Americans 65 and older is expected to grow from 40 million today to 88.5 million by 2050. In just 20 years all baby boomers will be over 70 years of age. The figure below documents the expected growth of Maryland’s older licensed driver population over the next 25 years. The number of Maryland drivers over 70 is expected to double in 7 years and more than triple in 15 years.
 Maryland Older Licensed Driver Population – 2013 to 2040
Projections Based on Maryland FY 2013 Actual Licensed Drivers
Crash By Jurisdiction
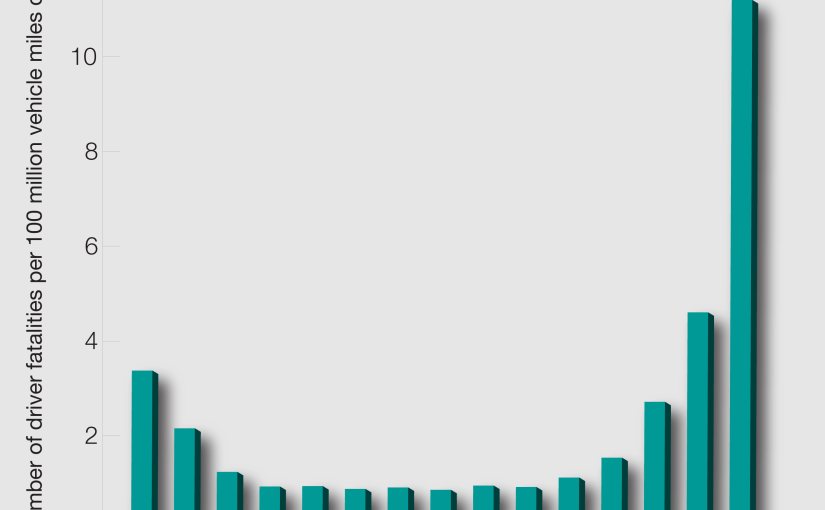
Older drivers become more crash prone with age, even though they drive less. According to the National Highway Traffic Safety Administration, fatal crash rates per mile traveled begin to grow starting at age 70, and increase notably after age 80.

Maryland Older Driver Injury Crashes by Jurisdiction, 2011
Recommendations For Maryland
Road safety policies must be crafted and implemented to address the growing number of older drivers in Maryland. Based on national and state-based research and federally recommended best practices, it is clear that older drivers require screening of their physical and cognitive functionality every two years. As Maryland policymakers review the literature and determine a course of action, there are certain steps Maryland can take immediately to improve road safety:
1. Increase referrals to Medical Advisory Board (MAB)
• Inform health care professionals of the role of the MAB and urge them to identify and refer patients with problems that affect driving.
• Provide training to law enforcement on identifying drivers with problems that affect driving.
• Allow electronic referrals for law enforcement and health care professionals to ease referrals to MAB.
2. Shorten driver license renewal period for older drivers to every two years
• Reduce the fee of each renewal to avoid a greater financial burden on older drivers from more frequent renewals.
• Educate drivers of the cognitive and physical problems that affect driving.
• Inform older drivers of driver education classes for older drivers and rehabilitation services available from occupational therapists to improve driving safety.
3. Raise Awareness
• Educate drivers and their families of the cognitive and physical problems that affect driving.
• Distribute information on driver education classes for older drivers that will help them stay safe.
• Provide local agencies on aging with the training and materials necessary for them to counsel older drivers.