Fatalities Per Mile Driven
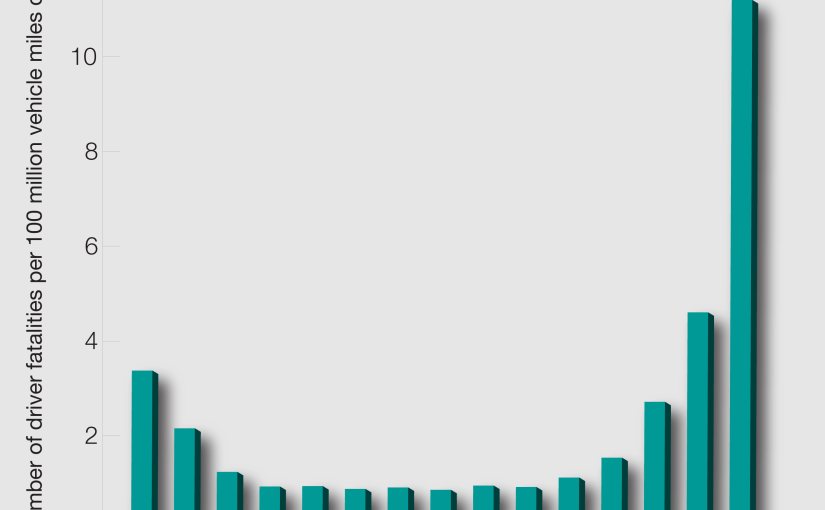
Older drivers become more crash prone with age, even though they drive less. According to the National Highway Traffic Safety Administration, fatal crash rates per mile traveled begin to grow starting at age 70, and increase notably after age 80. This is largely due to a susceptibility to injury and fragility among older drivers. Age-related declines in vision, physical mobility, reaction time, and cognitive impairments may affect some older adults’ driving abilities. After age 70, typical changes include slower information processing in the brain, and therefore a lengthening of the amount of time it takes to make quick decisions on the road. Studies have shown that distractions are more difficult to ignore as people age. The following graph documents the annual number of U.S. deaths of drivers by age per 100 million vehicle miles traveled.

United States Annual Fatalities of Drivers per 100 Million Vehicle Miles Traveled